

The DailyTradr is for informational and educational purposes only. Nothing in this newsletter is financial advice, trading advice, or a recommendation to buy or sell any asset. Always do your own research and consult a professional before making financial decisions.
Jump to Section
This Week in Crypto
We saw a volatile week which included end of month volatility, first day of month volatility, additional news on tariffs, and reduced job numbers which caused some fear and uncertainty. We saw Crypto market cap drop 7% on August 1st with Bitcoin coming down 2.3% and Ethereum dropping 3.7%.
Opinion: It felt like a knee jerk reaction to a hot market that has been looking for some excuses for people to take profit. It seems like one piece of bad news was enough to see media start looking for more negative news to pile on. As a whole the downside seemed more focus on Stocks rather than crypto.

Bitcoin
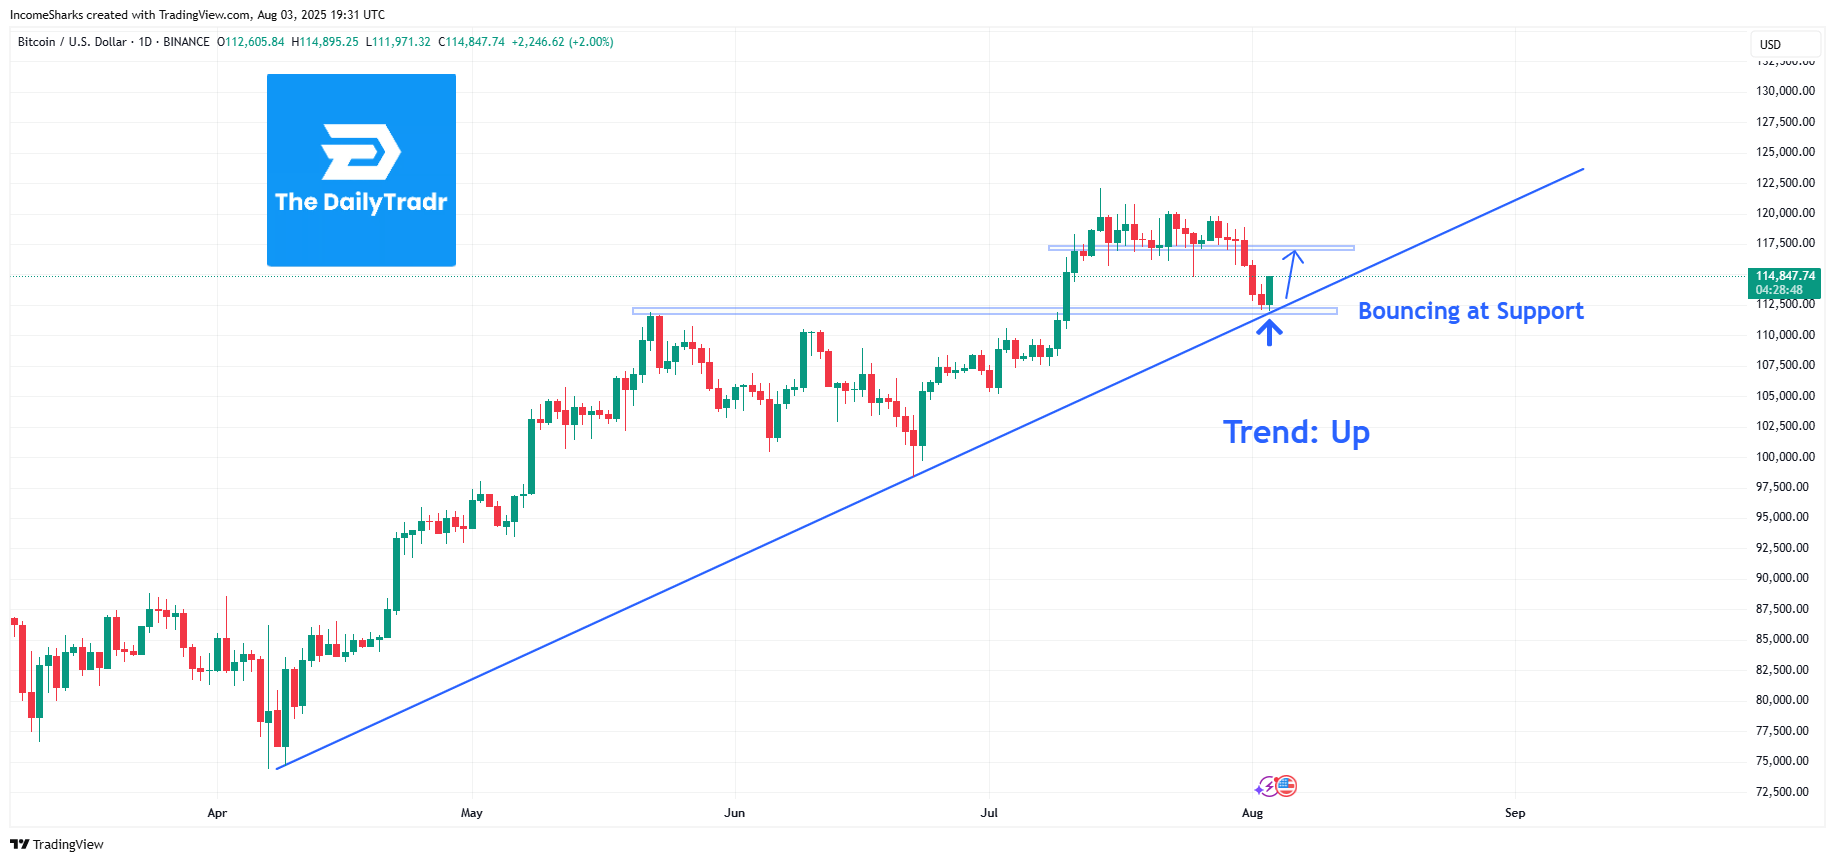
We saw a tight compressed channel breakdown as stocks sold off
Sentiment flipped bearish and sellers pushed down price
Higher time frame we still have BULLISH structure
We are right at the diagonal (blue line) which is showing the trend is still UP
We have also seen strong demand at this support level
By the next newsletter I’m predicting us to be at or above $117,000
STATUS: HOLD
Ethereum
After a big 4 day rally, followed by a massive 9 day really we are seeing a pullback
Market sentiment from stocks and Bitcoin selling off has caused a little panic
The higher time frame structure is bullish as we are seeing a strong bounce here
Using Supertrend (Free Indicator) we see a perfect bounce on the green line
While sentiment might have shaken out some people this still looks just like a dip
STATUS: BULLISH

Total Crypto Market Cap
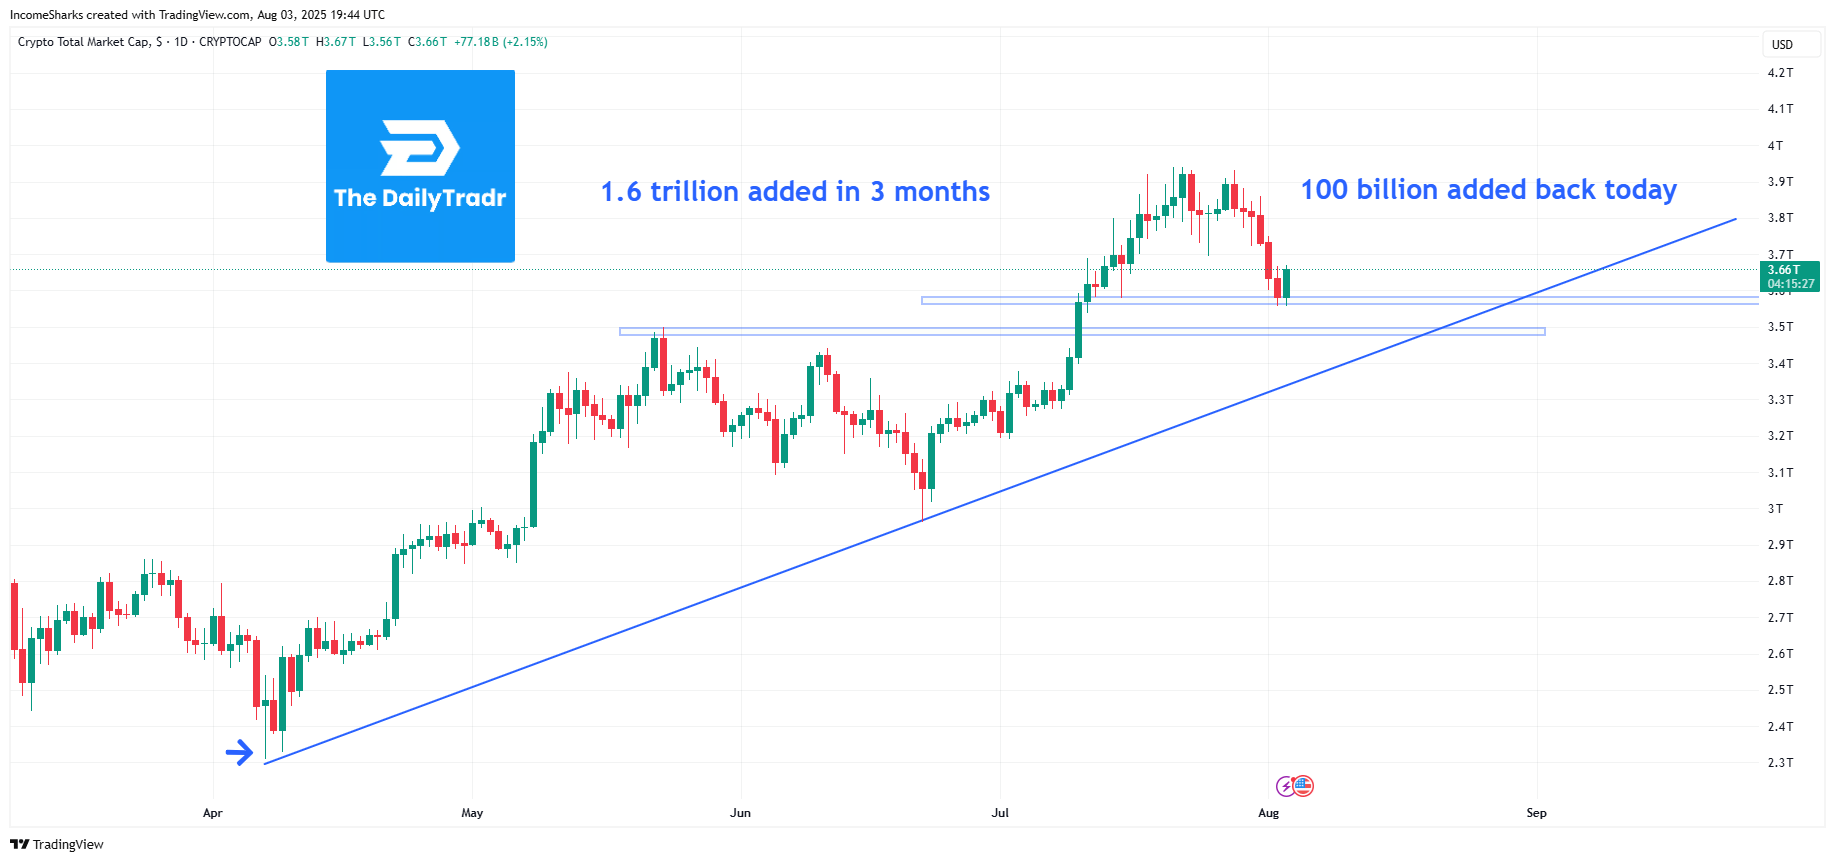
This week we lost around 243 billion in total market cap
The overall trend is bullish and up
The past 3 months we’ve added 1.6 trillion in market cap
Crypto as a whole is still showing strength and doesn’t appear to have topped
STATUS: HOLD/BULLISH
Altcoins
To track Altcoins (coins other than Bitcoin) we will be using the Total 2 Chart
We are forming a bullish channel assuming this structure holds
Ideal conditions for Altcoins to go up is Total Market cap going up, Bitcoin Dominance going down, and Total 2 rising.
DOMINANCE: At 62%, an increase of 2% higher from last week
ETHBTC: 5% decline since last week. When this trends higher it’s bullish for altcoins
STATUS: HOLD

🚀 On-chain Projects to watch
$BERRY: An AI token that’s built a strong and loyal community. Price overall is down significantly from an all time high giving it a much better opportunity. Momentum has returned and price just broke some local resistance today. Up 33% today
Current Marketcap: $13 million. Dextools Link
$PAPPLE: A Dex token launched by the Proof team which has been one of their best performers. On a 47% dip from an all time high with what seems to be some bullish consolidation. Up 4.6% today
Current Marketcap: 7.6 million. Dextools Link
$GURU: This is a token that’s held in 95% of their traded funds. Their platform reached 2 million in total value traded and momentum has been building in the chart and the attention it’s reached. Some traders are returning over 1,000% publicly with the ability for anyone to copy the same trades. Up 10.5% today
Current Marketcap: $5.85 million. Dextools Link
Will share updates next week on the performance of these
This Week in Stocks
This was a volatile week for the stock market which saw a new ATH for the S&P 500 but later saw a two day pullback that wiped out almost all gains for the month of July. August 1st alone was the VIX (Volatility Index) shoot up 17%. The US job reports had downward revisions which sent a lot of panic and concern to the markets.
We also had FOMC which saw no rate changes. There was some additional tariff news which could have also led to the end of month/first day volatility. There were also less important news topics such as some political drama with Russia and a response with putting a submarine closer.
Opinion: Markets were due for some sort of correction as July was very hot and saw consistent all time highs. The market has felt extra frothy and there has been a lot of posts celebrating huge wins in a short period. Panic is hard to predict but it feels like we should stabilize this week. There was a lot thrown at the markets in an already volatile week so if that was the extent of the sell off that would be very bullish overall.
S&P 500
What appeared to be a very volatile week with bearish sentiment has the chance to be just that. Structure shows a bullish channel, and nothing more than a re-test to horizontal and diagonal support.
$SPY is still up 28% from the lows
A 3% pullback from All Time Highs.
There’s now a higher gap and think by the next newsletter there’s a good chance that gap is filled (See box and arrow).
STATUS: BULLISH/HOLD

Events Next Week
Nothing too major this week. Some additional earnings on popular stocks like $PLTR. US Trade Deficit Numbers are suppose to go from -75 billion negative to 61 billion positive which might cause a positive reaction.
US Trade Deficit Numbers - August 5th
New US tariffs go live August 7th (Such as 35% Canada, 15% Japan)
Consumer Credit - August 7th
Initial Jobless Claims - August 7th
🔥 Stocks to watch
These are stocks that I’m watching for upside potential with either good fundamentals or forming strong technical patterns.
$TGT ( ▼ 0.26% ) (Target)
Longer term value play that is down 62% from its high. Looking to see this lower channel hold support and eventually see momentum push above the higher end. Ideally would want to see that top line get hit in 2025 or 2026.

$NGVC ( ▲ 6.7% ) (Natural Grocers)
Strong bullish trendline with upcoming earnings this week. Assuming earnings is at expected or higher than expected should see a nice bounce. Especially at horizontal and diagonal support. Could see a move to $44 by end of month.

$DRD ( ▼ 3.47% ) (DRD GOLD)
This is a gold mining play based on possible momentum if the red line support holds and we see it break out or above the green line. Some might still be looking to hedge tariffs or a stock market pullback so it’s a way to play the downside with momentum of a chart forming a bullish structure.

🏆 Featured Guest
We will be featuring a content creator next week! Stay tuned
Thanks to this weeks contributions by:
@IncomeSharks on X (formerly known as Twitter)
The DailyTradr
Follow @dailytradr on X (Twitter) to give feedback, suggest content or creators you’d like to see featured, and to keep up to date.